Prediction Statistics
In this study, we analyzed all complete bacterial genomes in NCBI RefSeq (Release 226, n = 49,333) and this page displays PSOSP tool prediction statistics, including ditributions of prophages, genera retained/filtered out in analysis, prediction results and other detailed data. You can use the search function to quickly find specific data.
Overview
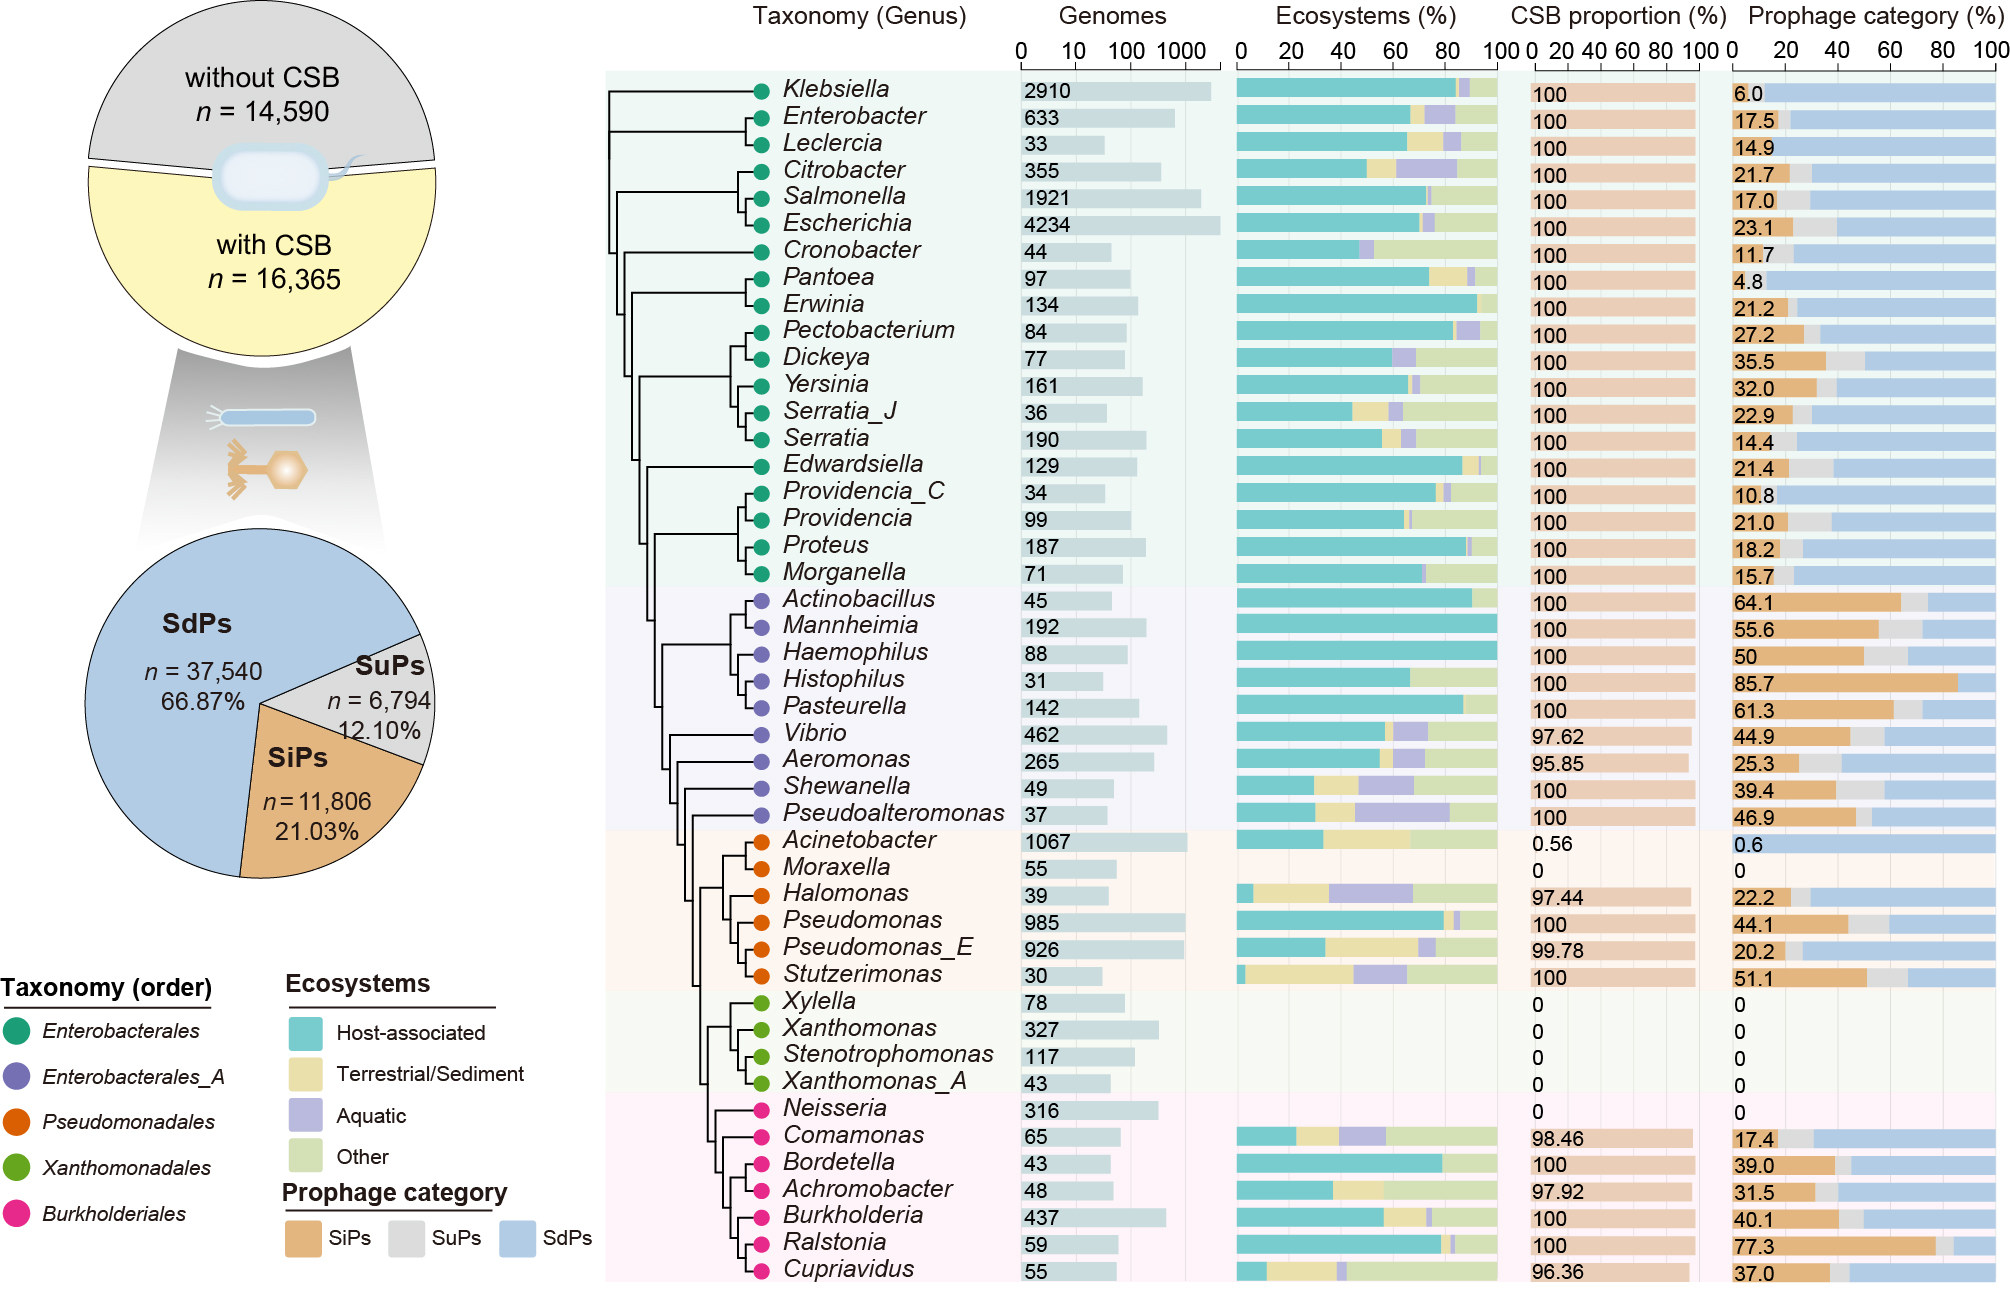
Distribution of bacteria with CSBs and non-CSBs (top panel) and the proportions of SiPs, SdPs, and SuPs among prophages (bottom panel). And distribution of prophages types in Gammaproteobacteria. For clarity, only genera with ≥ 30 genomes are shown.
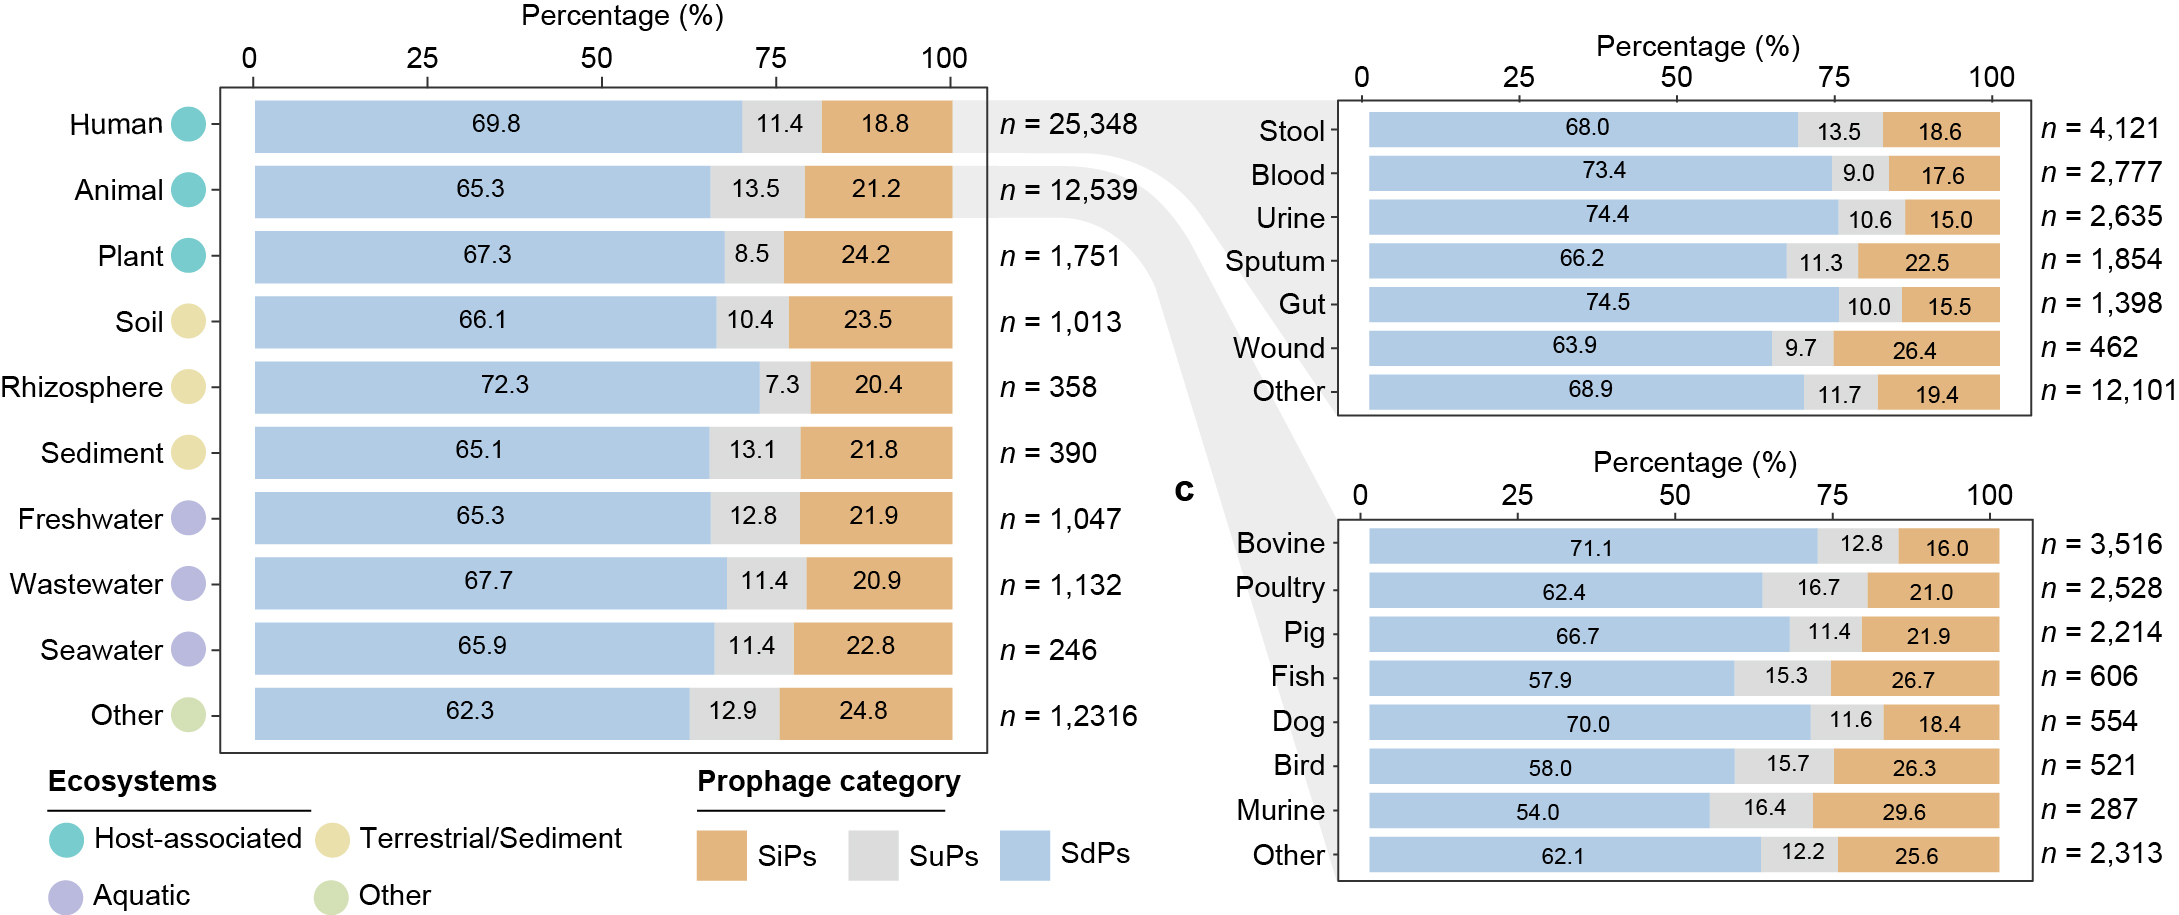
Environmental distribution of SiPs, SuPs and SdPs.
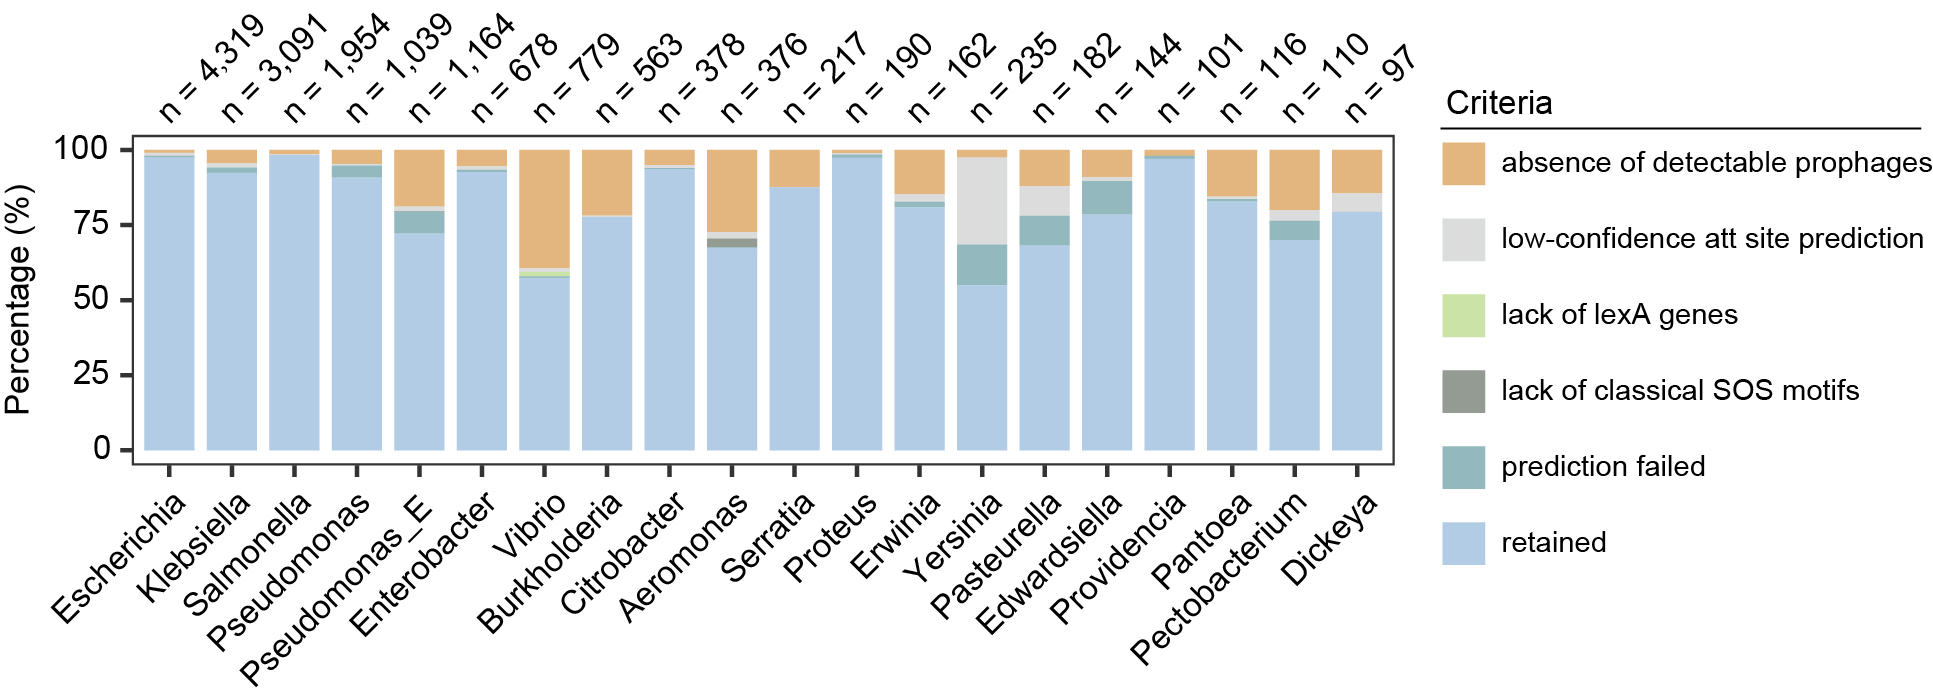
Genera retained in the analysis, showing only the top 20 genera with the highest number of retained genomes.
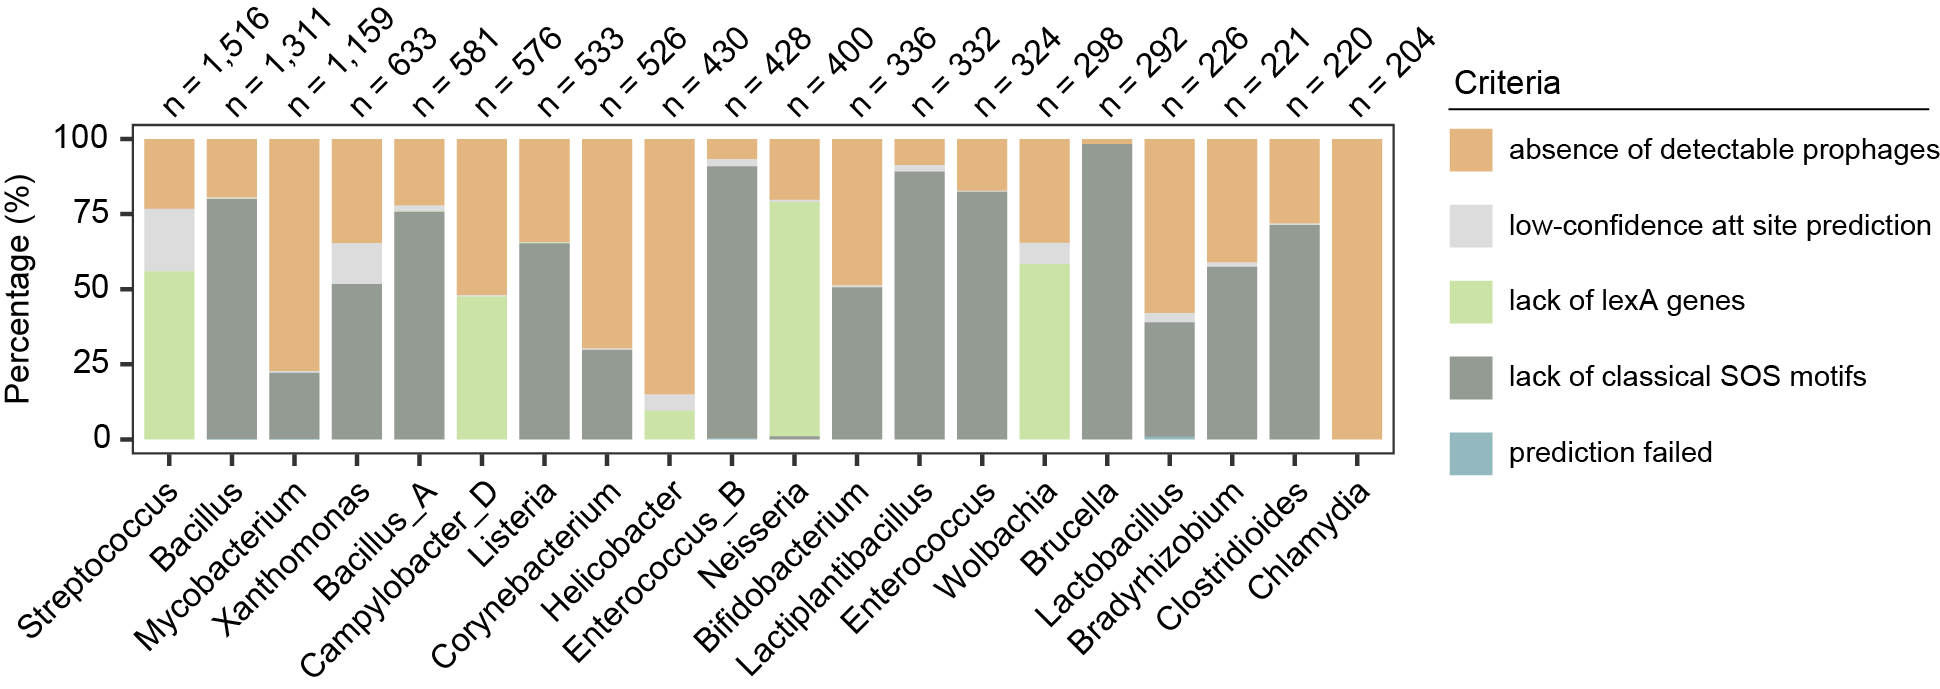
Genera filtered out from the analysis, showing only the top 20 genera with the highest number of filtered genomes.
Table 1: Genera Retained in Analysis
(genera with genomes passed the stringent filtering pipeline in our analysis)
Loading genus retained data...
Table 2: Genus filtered Out in Analysis
(genera without genomes passed the stringent filtering pipeline in our analysis)
Loading genus filtered out data...
Table 3: Detailed data of all classified prophages
Loading data...
Visitor Maps
Real-time display of visitors from around the world